KELSEY NANAN
KN
Data viz
Dataviz
Writing
Highlighted Work
Anthropic Economic Index
2025
30 Day Chart Challenge
2025
Streets to Stability
2024
The Tortured Data Viz Department
2024
CVI by the numbers
2023
All Work
Reducing methane emissions in the global food system
A Decade Wrapped
2023
The rise & fall of data viz tools
2022
Broadband Coverage in New York State
NYC 2020 Subway Ridership
Fast-food-scape in America
Planetary Health Report Card Initiative
Tastes over Time– an Analysis of Spotify Data
Proximity to parks & transit stations in NYC
2021
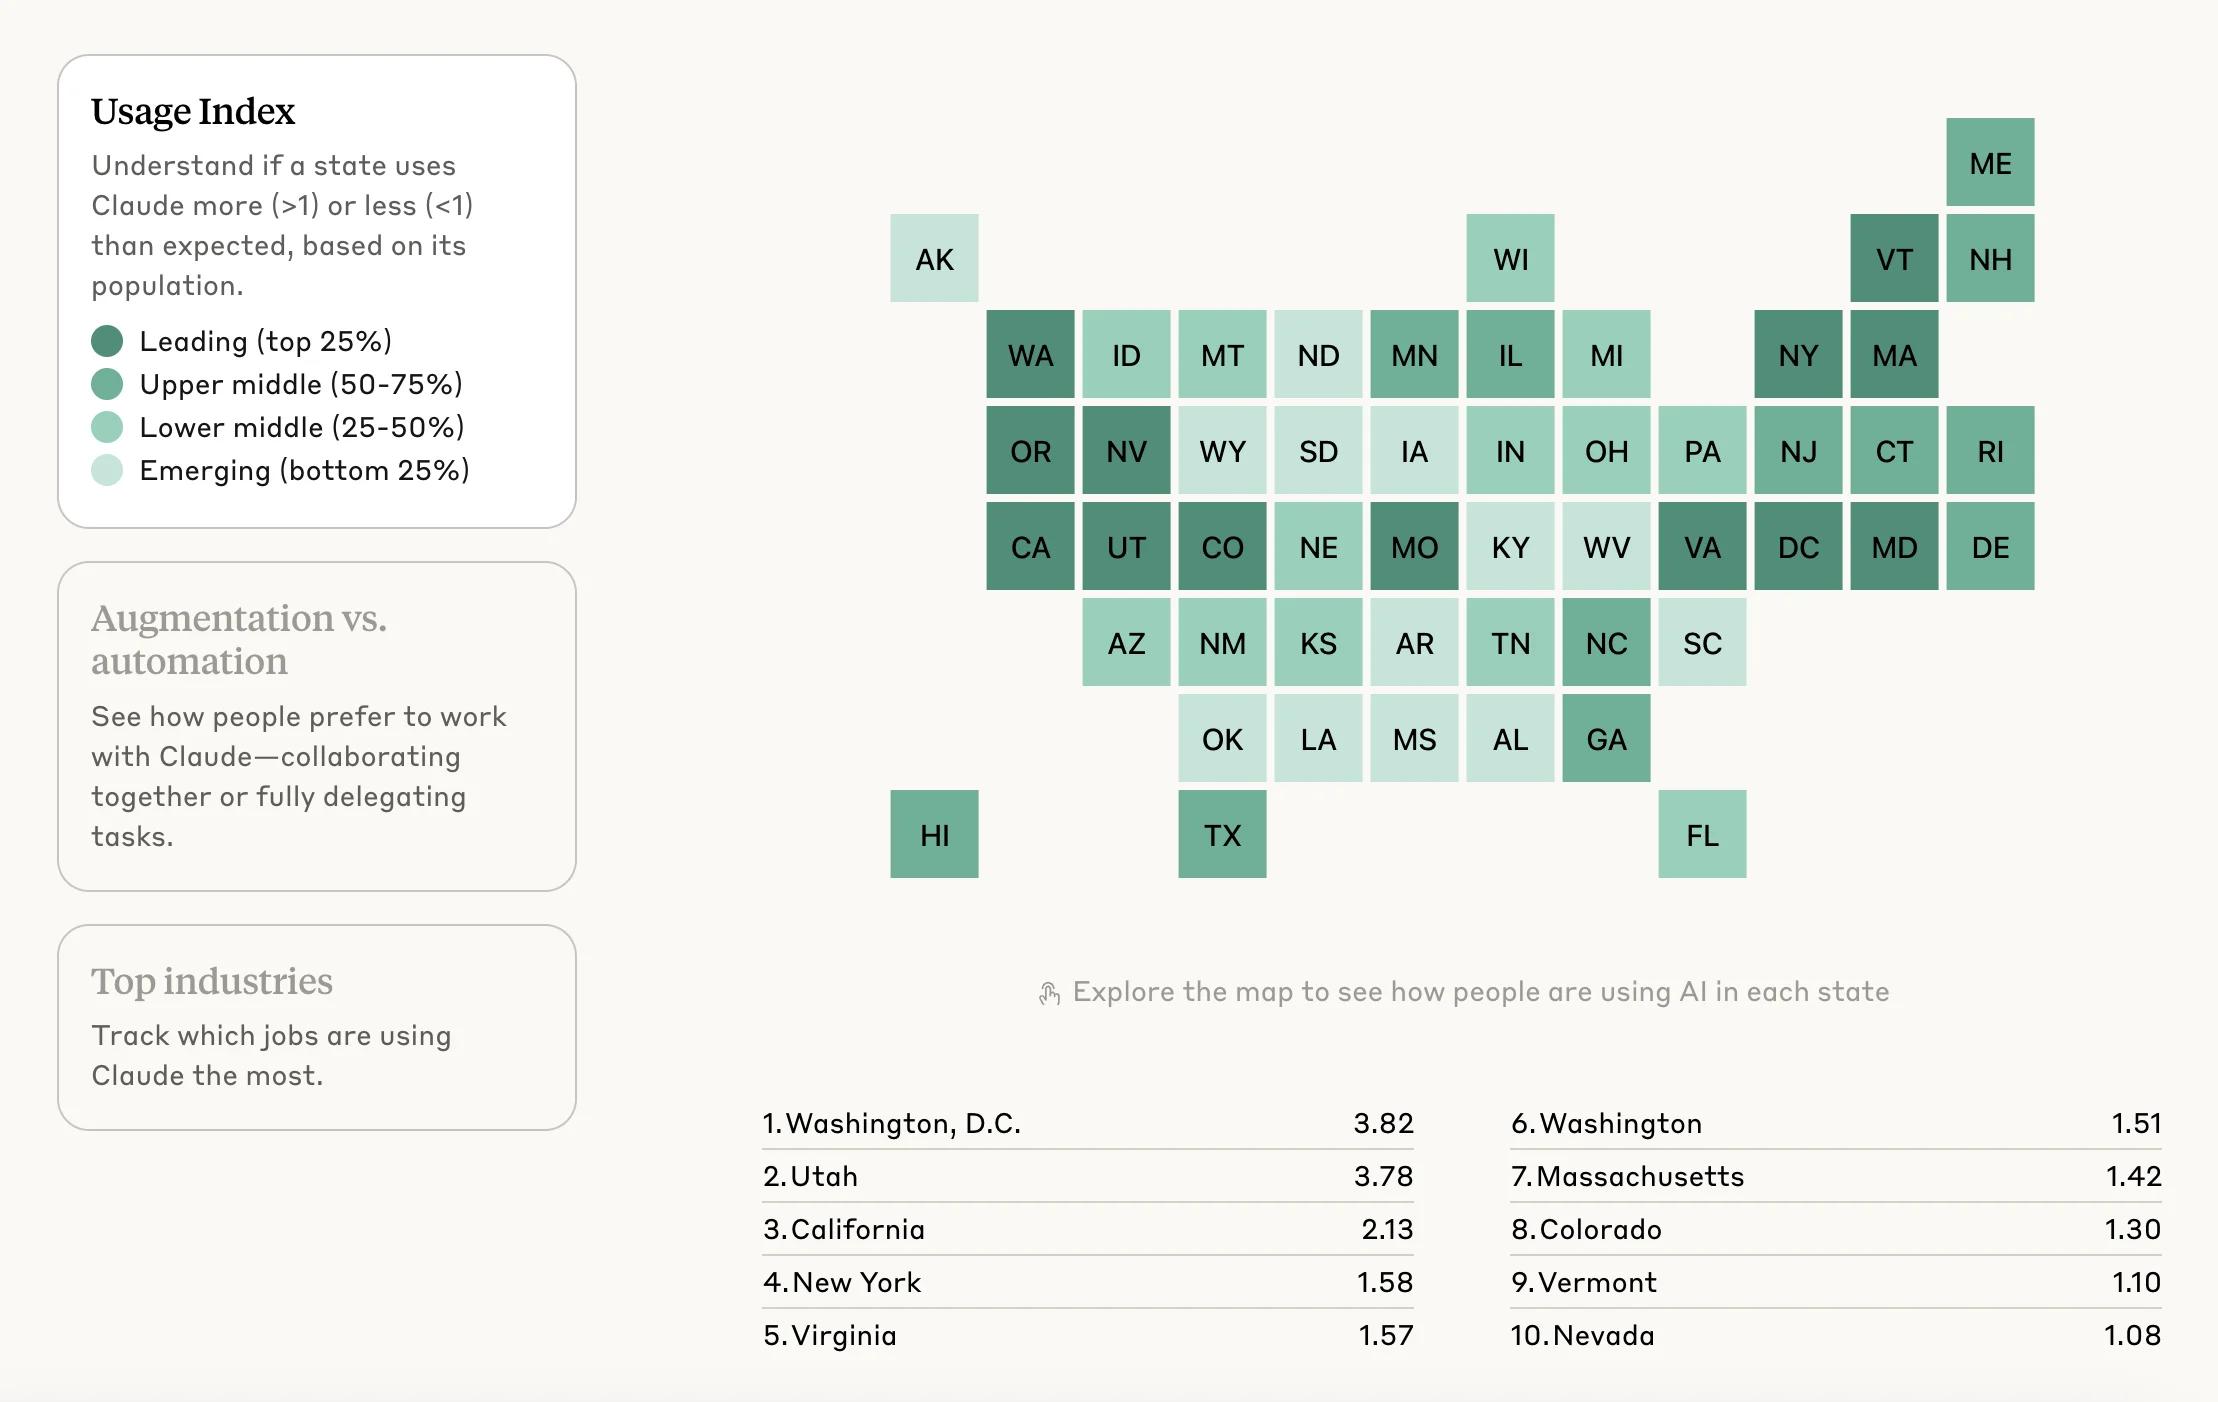
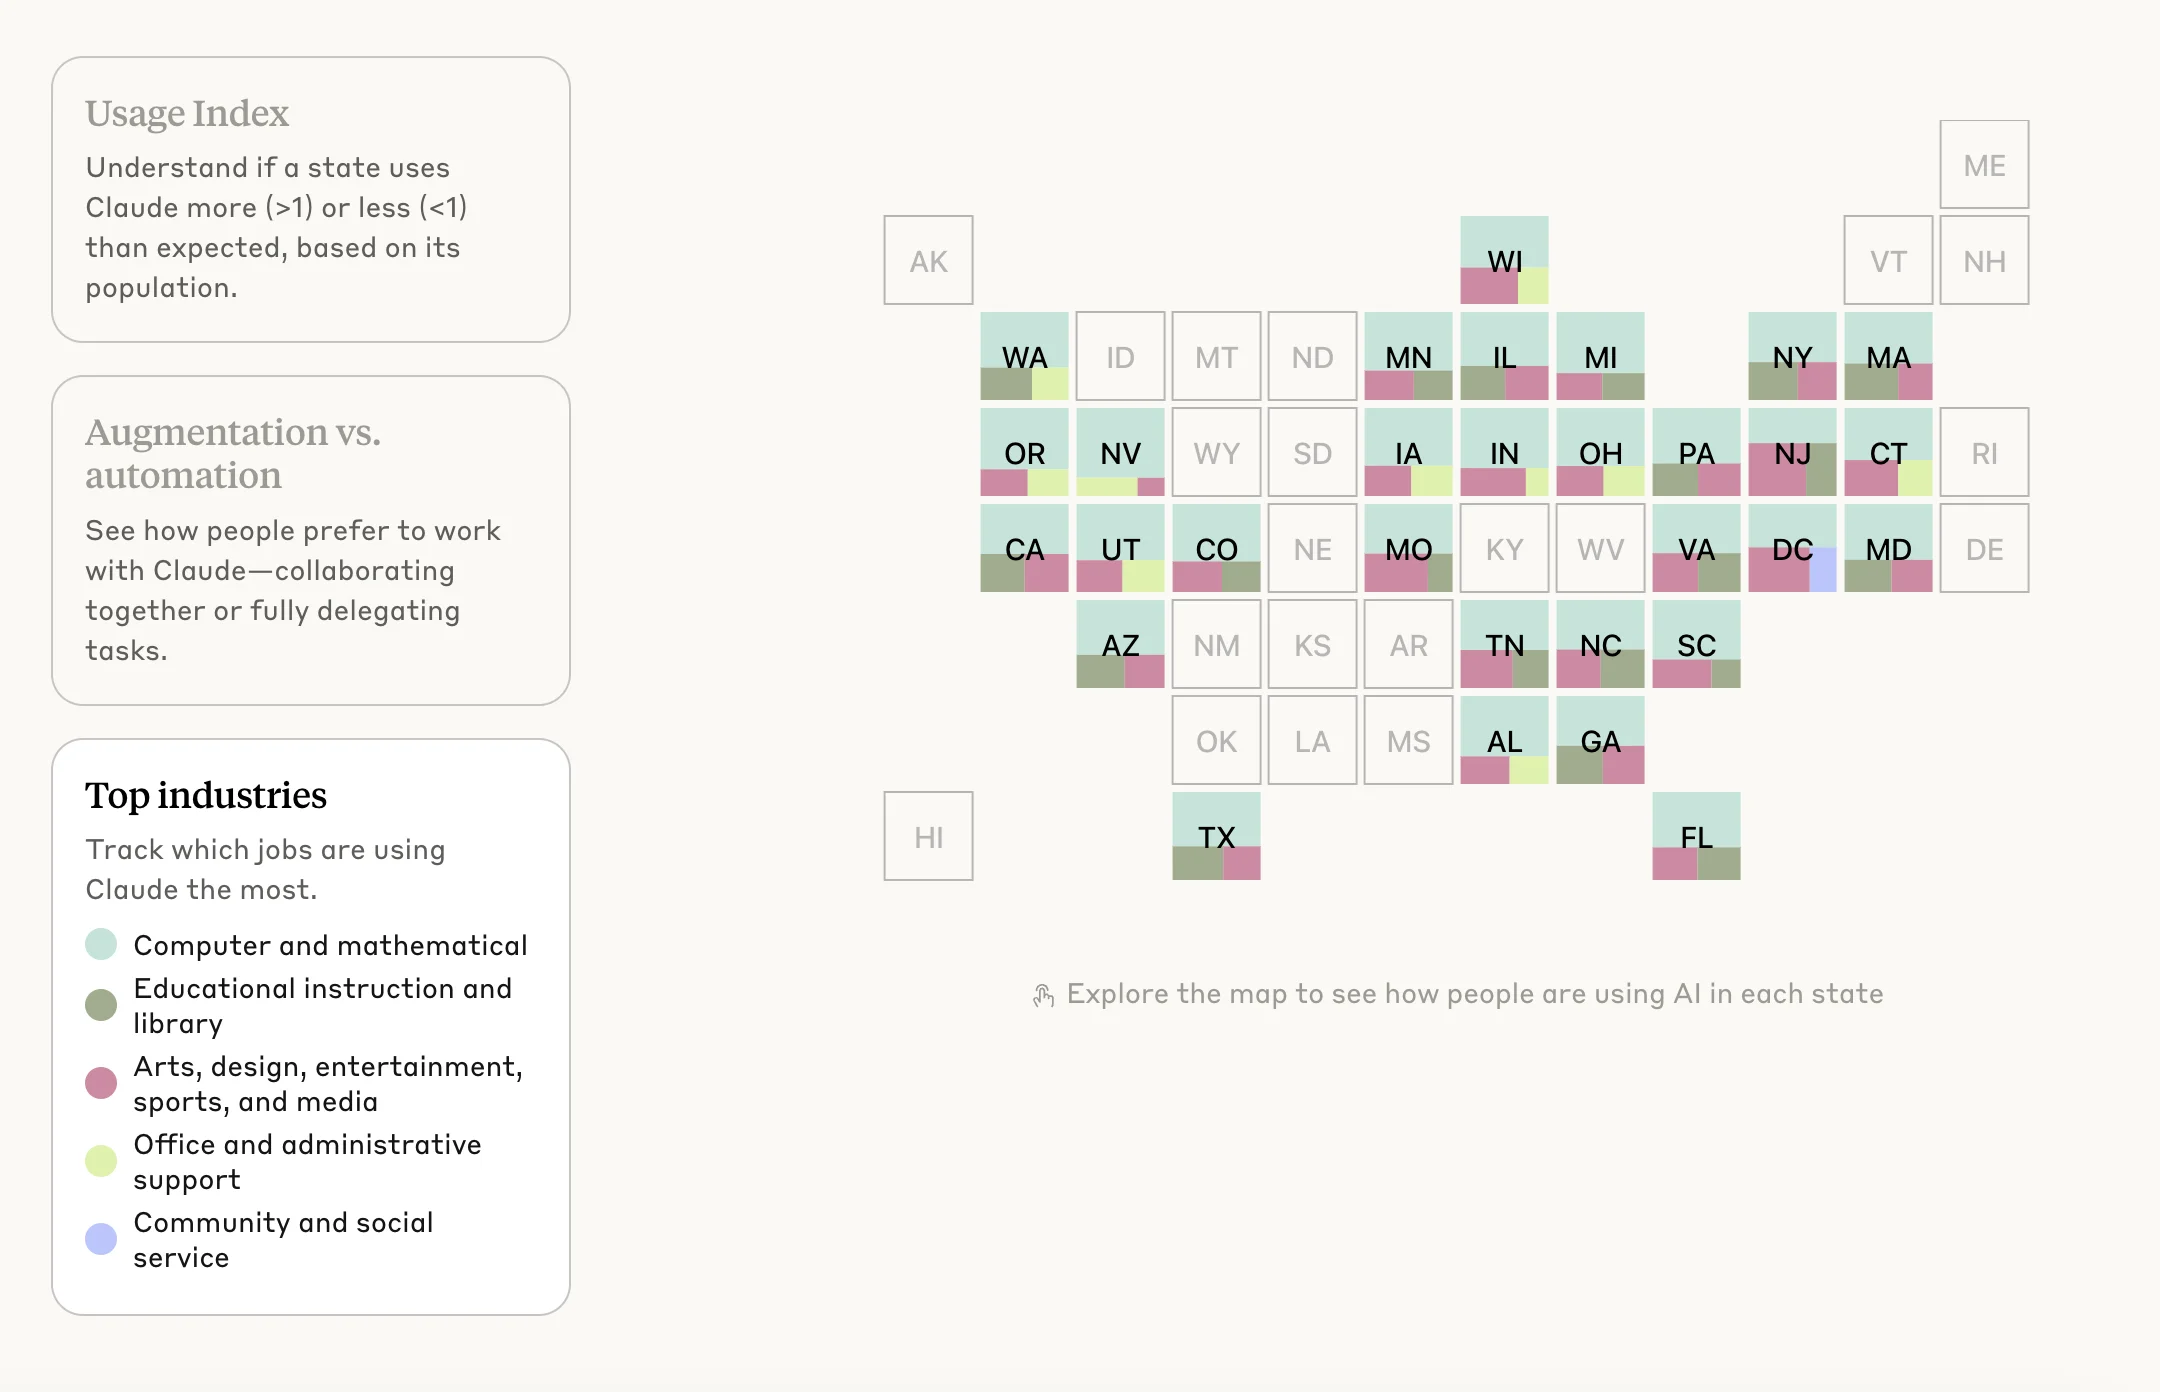
Anthropic Economic Index (2025)
I designed and coded visualizations for Anthropic's Economic Index, which presents data on how people are using Claude through various lenses.
CLIENT:
Anthropic
View project
Visualization of comprehensive state usage statistics and trends